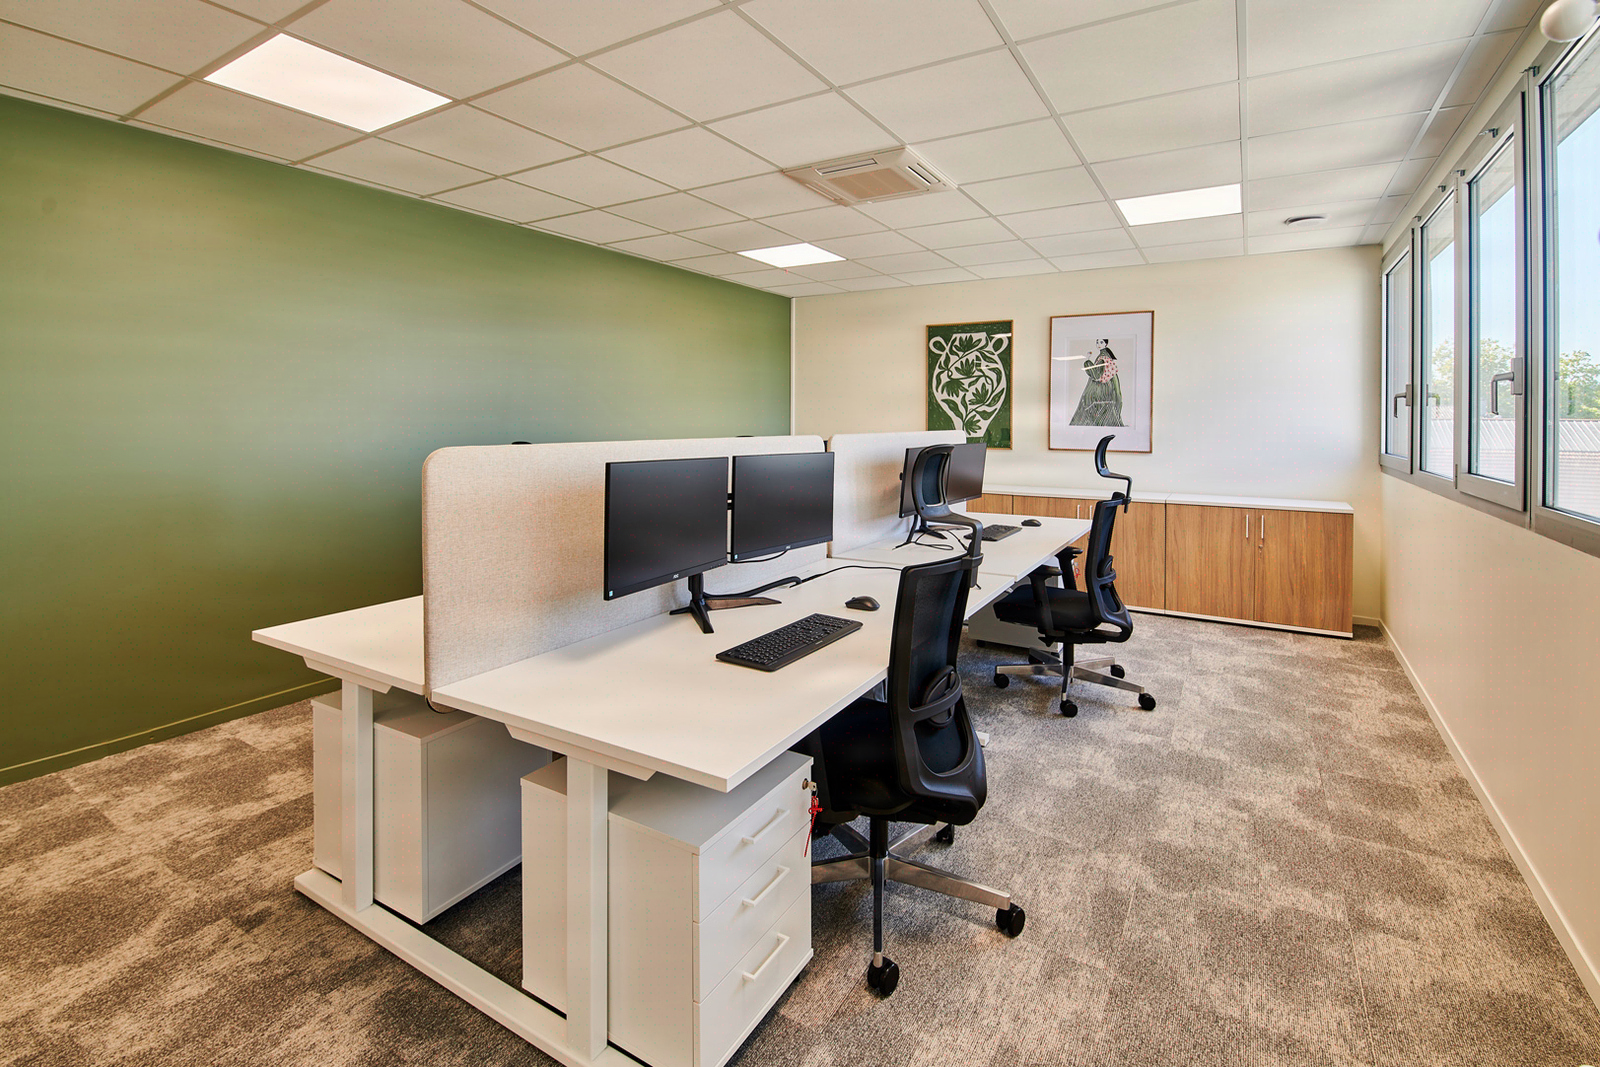
Desk sharing: calibrating the occupancy-to-flexibility ratio according to your business constraints
65-75% occupancy ratio: why a uniform 0.7 destroys ROI
The ratio of 0.7 desks per employee is a misleading average: applied uniformly, it degrades productivity through setup time without generating the expected rent savings. Effective desk sharing calibrates a target occupancy ratio tailored to each organisation, segmented by business profile, and reserves a share of dedicated desks for critical functions. Kytom carries out a behavioural audit, sizes the additional support areas and supports change over a period calibrated to the size of the site. For the CFO, the issue is not the gross square metres freed up but the square metres freed up net of hidden additional costs: buffer zones, phone booths, change management.

Contrary to common practice among workplace programmers, Kytom does not recommend a single ratio applied to the entire site. Our reading differs: the ratio is a variable per zone, not per site. Three trade-off variables structure the calibration.
Actual presence varies significantly depending on function: mobile sales profiles occupy their desk very intermittently, R&D teams show moderate presence, while administrative support functions are the most sedentary. These behavioural differences are decisive in calibrating the desk sharing ratio. Predictable peaks (plenary meetings, quarterly training, accounting close) require a capacity reserve of 10 to 15%. Confidentiality needs (HR, legal, finance) justify retaining dedicated desks.
The common mistake is to apply a uniform ratio of 0.7 desks per employee without segmenting by business profile. Behavioural audits systematically reveal significant gaps between declared presence and actual presence, justifying segmentation by business profile rather than a uniform ratio.
- Sales staff and field consultants: ratio 0.5 to 0.6
- Hybrid project teams: ratio 0.7 to 0.8
- Sedentary support functions: ratio 0.9 to 1.0
- Sensitive functions (HR, legal): dedicated desk
Zone-by-zone calibration, integrated from the programming stage in design and build, avoids costly corrective adjustments after delivery. When desk sharing is not the right answer. Below a certain desk threshold, pooling degrades ROI: the additional cost of the audit, booking tool and shareable furniture can exceed the rent savings freed up, particularly on small sites. Organisations whose average actual presence exceeds 85% (regulated back-office, call centres, production functions with fixed equipment) do not generate any usable sharing margin: desk sharing there becomes theoretical and destroys user trust. Likewise, on sites with high turnover of project teams lasting less than 6 months, usage instability makes calibration unstable: it is better to keep dedicated desks and invest in flexible project rooms.

For the CFO and Asset Manager: reading the space gain in net square metres, not gross
Workplace orthodoxy presents desk sharing as a rent-reduction tool. For the CFO, this reading is incomplete. The gross square metres freed up must be reduced by three structural additional cost items.
Additional support areas. Freed-up desks generate more informal interactions, which must be absorbed in buffer zones: phone booths, alcoves, project lounges. Without these zones, ambient noise exceeds comfort thresholds and leads to site avoidance.
Setup time, unbilled but paid for in payroll. Each desk change generates significant reinstallation time — screen, keyboard, headset, seating adjustments — which represents a silent payroll cost to factor into the desk sharing ROI calculation.
Budgeted change management. The majority of post-delivery resistance stems from a lack of behavioural support: budget for change management from the design phase. For the Asset Manager, the asset value post-fit-out depends on the actual usage rate at 6 months, not on the plan. A desk-share site at 50% actual occupancy is worth less than a closed-office site at 90%.
The net gain calculation therefore reads: gross rent freed up minus support area minus setup payroll minus support budget. In our recent experience, the stabilised net gain sits significantly below the gross gain displayed.

Four recurring tensions: collaboration, setup, profiles, change management
Desk sharing projects encounter four friction points documented across our projects since 2006. Each tension calls for a specific design response, integrated into the programme before furniture selection.
- Undersized informal collaboration spaces. Freed-up desks generate a surge in informal interactions that must be absorbed in buffer zones (phone booths, alcoves, project lounges).
- Ignored setup time. Each desk change requires several minutes of reinstallation, an invisible cost that accumulates over the week and justifies rapid personalisation solutions (mobile lockers, saved screen profiles).
- Standardised profiles. A standardised desk covers neither multi-screen needs (finance, design), nor HR confidentiality, nor bulky storage.
- Absent change management. The majority of post-delivery resistance stems from a lack of behavioural support, not from the furniture itself.
Good practice segments the space into functional zones rather than identical desks, distinguishing two major profiles: sales/collaboration (dynamic, bright clusters) and engineering/concentration (acoustic desks, target below 35 dB(A) in quiet zones, in line with the ranges recommended by Cerema Acoustique des bureaux, 2023).
The Kytom method in 5 steps: audit, calibration, design, prototype, support
The desk sharing implementation methodology is structured in five sequenced phases, deployed over 14 to 20 weeks depending on the size of the site.
| Step | Duration | Deliverable |
|---|---|---|
| 1. Behavioural audit | 4 to 6 wks | Occupancy mapping, target ratios |
| 2. Calibration by zone | 2 wks | Space programme, profiles |
| 3. Functional design | 4 to 6 wks | Plans, furniture, flows |
| 4. Pilot prototype | 3 to 4 wks | Test space, adjustments |
| 5. Usage support | 8 to 12 wks | Training, booking tool |
The audit measures occupancy rates by time slot (presence sensors and badging), maps interactions and identifies specific needs. The calibration sets the target ratio per zone and sizes the additional support areas. The design integrates zoning by usage profile and the choice of shareable equipment. The pilot prototype tests a floor of 30 to 50 desks over 3 to 4 weeks, with usage measurement and adjustment before full deployment. Usage support covers training, booking tool and follow-up at 3 and 6 months.
Frequently asked questions
Which desk sharing ratio should be chosen for a 200-desk office site?
No single ratio suits 200 desks. Calibration is segmented by role type: 0.5–0.6 for mobile sales teams, 0.7–0.8 for hybrid project teams, 0.9–1.0 for sedentary support functions, and a dedicated desk for sensitive roles such as HR or legal. A 10–15% buffer covers predictable peaks. A behavioural audit measures actual attendance before any calibration.


