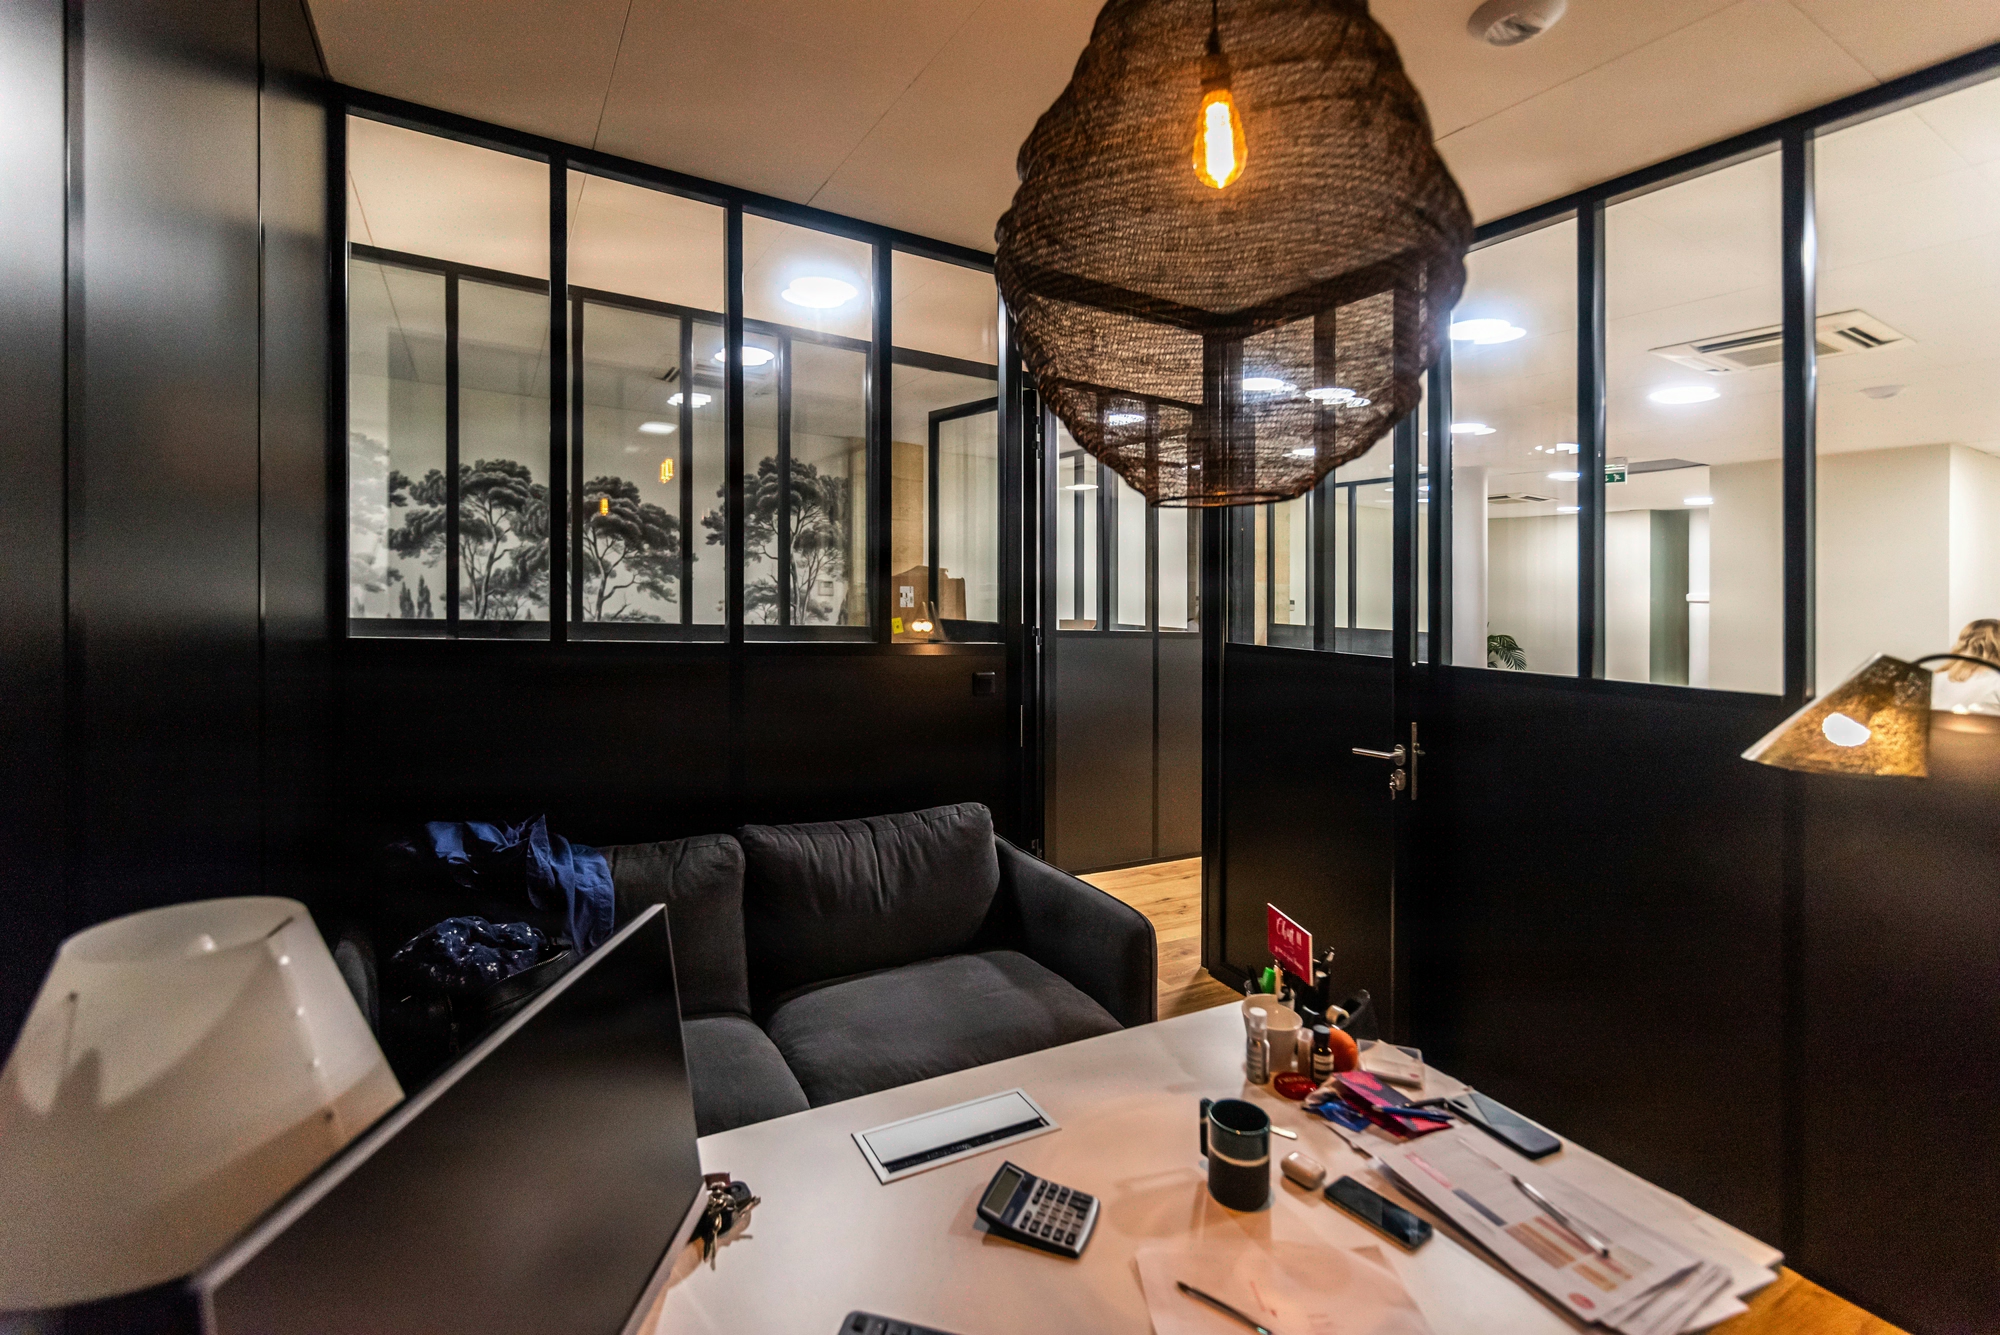
Office layout scenarios: comparing 3 variants to decide
Three canonical scenarios costed per m² per workstation
The right scenario is not the densest: in most of the trade-offs we support, our clients select a hybrid model rather than pure flex. With actual occupancy rates often below 60% recorded across French office floors, the equation 1 workstation = 1 employee is obsolete, but systematic densification to 6 m² per workstation is equally so. Deciding generally commits between 800 and 1,500 euros per m² depending on the level of fit-out, and commits the organisation to 5 to 10 years of operation. Comparing 3 contrasting scenarios via 12 indicators objectifies CAPEX/OPEX trade-offs. Kytom, present in 11 offices across France and Spain since 2006, structures this scenario-building in 12 weeks with interior architects, programmers and construction economists, integrating the regulatory obligations to reduce energy consumption in the tertiary sector, the acoustic requirements applicable to offices, article R.4214-1 and satisfaction surveys at 6 months.

Tertiary Decree no. 2019-771 of 23 July 2019 applies to buildings used for tertiary purposes with a floor area greater than or equal to 1000 m² and requires a reduction in energy consumption of 40% in 2030, 50% in 2040 and 60% in 2050, declared and indexed to the heated area and occupancy density. Three scenarios structure the tertiary real estate trade-off:
- Assigned desk: 10 to 12 m² SUN per workstation, 1 workstation per employee, the historical benchmark of the French tertiary sector.
- flex office: 7 to 9 m² per workstation, ratio of 0.7 to 0.8 workstations per employee, densification of 25 to 35%.
- Activity Based Working (ABW): 6 to 8 m² per workstation, zoning by activity (concentration, collaboration, video conferencing, social).
Tertiary uses are framed by the available sector observations, and artificial lighting must comply with the criteria and illuminance levels of standards NF EN 12464-1 and 2 (INRS). The usable area ratios (8 to 12 m² in open space, 12 to 18 m² in enclosed offices) are common orders of magnitude and not a standard. Each scenario carries distinct consequences in CAPEX per m², annual OPEX and Labour Code compliance (R.4214-1 et seq.).
Our reading differs from the dominant flex-first discourse: on the projects we support, the winning scenario is generally not ABW at 6 m² but a weighted assigned/flex hybrid at 8-9 m² per workstation. The professional orthodoxy underestimates the hidden cost of ABW fragmentation below 800 m² usable, where the 4 activity zones generate undersized micro-spaces and furniture overcosts without any real gain in floor area.
When these scenarios do not apply: below 30 employees on a single floor, a 3-scenario trade-off is disproportionate; a simple framing of assigned desks and 2 fallback rooms is enough. flex office is contraindicated if the measured presence rate exceeds 75% (sedentary production teams, R&D laboratory, accounting close): densification then creates more friction than gain.

Scenario-building method in 12 weeks and 4 deliverables
Kytom scenario-building rolls out over the standard timeframe and mobilises 4 successive deliverables structuring the final decision.
- Weeks 1 to 3, occupancy diagnostic: presence sensors or field observation over 10 working days, measurement of the presence rate, mapping of uses (concentration, collaboration, video conferencing, social).
- Weeks 4 to 6, building the 3 costed scenarios: multi-criteria grid of 12 indicators (m²/workstation, CAPEX per m², annual OPEX, kgCO2e/m², ERP compliance, RGAA accessibility of the associated digital tools, projected satisfaction).
- Weeks 7 to 9, 3D modelling: dimensioned plans at 1/100, photorealistic perspectives, furniture sheets compliant with the BS EN 1335-1 benchmark distinguishing types A, B and C according to the adjustment range of office chairs (FIRA).
- Weeks 10 to 12, trade-off workshop: financial simulation at 5 and 10 years, reasoned recommendation to the management committee.
The teams mobilise interior architects, programmers and construction economists, with a quality process across all phases. A managerial validation workshop is integrated in week 11, before the final trade-off.
For the CFO and the Asset Manager: what the 12-indicator grid secures in committee. The workplace trade-off is first and foremost a cash-flow and asset-value trade-off. On a floor of 850 m² leased at 450 euros per m² CBD, freeing up 30% of floor area represents 115,000 euros per year of avoided rent, i.e. a flex ROI of 28 months for a CAPEX of 1,100 euros per m². The grid therefore explicitly incorporates energy OPEX (energy declaration), asset exit value (densification = rental revaluation per occupied m²) and exposure to tertiary regulatory risk by 2030 (administrative penalty). The 5- and 10-year modelling shifts to CAPEX vs OPEX depending on the financing method chosen (furniture purchase vs operating lease).
For projects under 500 m² or fewer than 50 workstations, this timeline becomes oversized: a compact 6-week format with 2 scenarios is sufficient. For projects over 5,000 m² across multiple sites, allow 18 to 22 weeks.
Measured benefits: floor area freed, ROI and satisfaction
Moving from assigned desks to flex office generally frees up 25 to 35% of floor area, i.e. for a floor of 850 m² an annual rental saving of 80,000 to 150,000 euros depending on location (prime rents in the Paris CBD versus regional metropolitan areas). ABW generally makes it possible to reduce the floor area per workstation to 6-8 m², with an observed return on investment over 30 to 36 months depending on location and the level of CAPEX. Post-move-in employee feedback is broadly positive, particularly on the quality of concentration and collaboration spaces.
| Scenario | m²/workstation | Floor area freed | Average ROI | Satisfaction (delta) |
|---|---|---|---|---|
| Assigned desk | 10-12 m² SUN | benchmark | n/a | benchmark |
| flex office | 7-9 m² | 25-35% | 24-30 months | +5 to +10 pts |
| ABW | 6-8 m² | 15-20% | 30-36 months | +12 to +18 pts |
The ROI is calculated on rental savings and energy OPEX, net of project CAPEX. These orders of magnitude are indicative and drawn from our recent projects. On the carbon side, the reduction in heated and air-conditioned floor area contributes to meeting the regulatory obligations requiring a reduction of at least 50% in the final energy consumption of the tertiary sector in 2040 compared to 2010, with a typical reduction of 20 to 30% in energy consumption per employee after switching to flex.
Contrary to the dominant commercial discourse among furniture manufacturers, the highest-ROI scenario is not the densest. In the trade-offs we support, the hybrid (60% assigned for stable teams, 40% flex for nomadic staff) generates a faster ROI than pure ABW, with a satisfaction delta 4 to 7 points higher. Maximum densification is a mathematical optimum, not an operational one.
When the ROI does not materialise: if the current lease exceeds 5 years with no break option, the rental saving remains theoretical and the flex ROI degrades beyond 48 months. If the negotiated remote work reaches 3 days per week, the presence rate falls below 35% and the equation shifts towards an absolute reduction in floor area, not densification.

Method
- Measure actual occupancy
Deploy sensors for 4 weeks across all workstations and rooms. This objective data eliminates declarative biases and reveals your real presence rate, generally 20 points below the managerial estimate. - Define 3 contrasting scenarios
Model a conservative variant (traditional), a median one (moderate flex) and an ambitious one (ABW). Each scenario must be a 2D plan, 3D perspective and technical sheet costed down to the lot. - Cost CAPEX and OPEX over 8 years
Include fit-out, furniture, IT, change management, energy and avoided rent. The 8-year projection corresponds to the average duration of a 3-6-9 commercial lease renewed once and reveals the true financial gaps. - Weight the multi-criteria grid
Bring together the CFO, HR Director and real estate management to weight the 8 criteria according to your priorities. This collegial step anchors COMEX buy-in and avoids late challenges during the works phase. - Decide and formalise the selected scenario
Document the decision with a synthetic comparison signed off in COMEX, incorporate the 3-year scalability clause and launch the APD phase. This traceability serves your CSRD obligations and reassures the works council.
Frequently asked questions
How many scenarios should be compared to decide on an office layout?
3 contrasting scenarios (assigned desk 10-12 m²/workstation, flex office 7-9 m²/workstation, ABW 6-8 m²/workstation) are enough to objectify the trade-off via a grid of 12 indicators. Below 30 employees or 500 m², 2 scenarios over 6 weeks replace the 3-way comparison.


