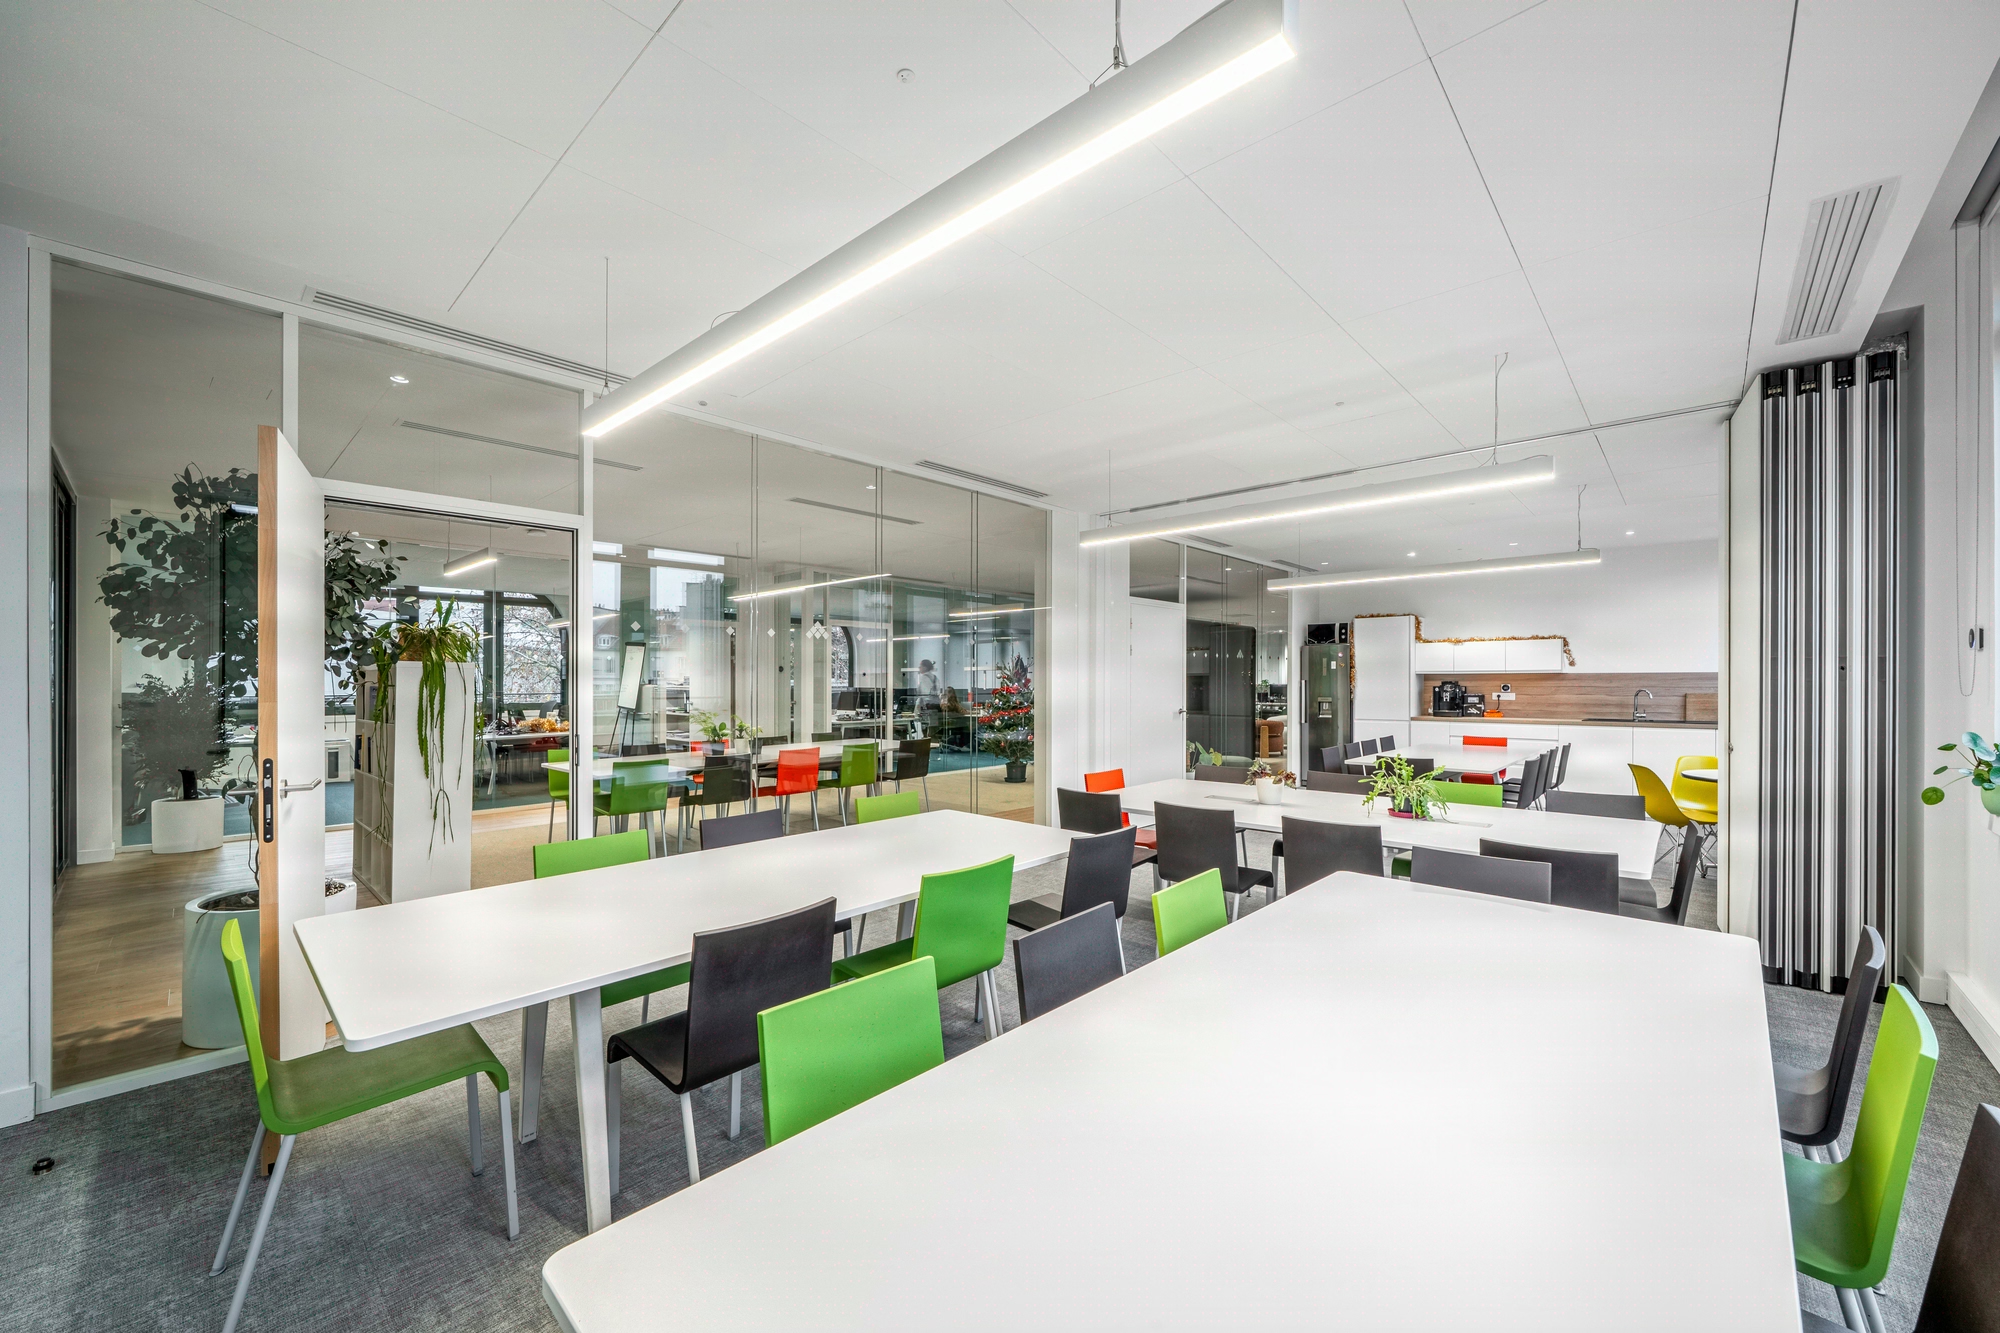
Presence detectors: sensitivity-autonomy calibration by use case
Three technical trade-offs that determine 15 to 25% of consumption
A poorly calibrated detector generates significant overconsumption: NF EN 12464-1 sets illuminance levels, not time delays, and this is precisely where the most common energy drifts occur. On our sites, post-delivery measurements regularly reveal that standard installations underperform compared to initial projections. The cause rarely lies with the hardware, but rather with theoretical occupancy assumptions substituted for actual flows. Three technical trade-offs determine performance: sensitivity versus stability, time-delay autonomy versus usage responsiveness, zoning granularity versus integration cost. This page details the four-phase Kytom behavioural audit methodology, the most frequent sizing errors, and the commissioning process that ensures lasting user acceptance.

The applicable standard defines lighting requirements for buildings by use (offices, schools, hospitals) and sets the required illuminance levels: 500 lux at the workstation, 300 lux in circulation areas, 200 lux in transit zones. These values guide the trade-off between the three dimensions mentioned.

Four sizing errors observed on taken-over projects
Diagnostics carried out on existing installations reveal four recurring errors that compromise energy performance.
- Sizing based on surface areas, not flows. A lightly used 50 m² zone does not require the same strategy as an equivalent high-traffic space. Regulatory standards specify a minimum of 10 m² per person in individual or shared offices: this threshold serves as a starting point, never as a final rule.
- Neglecting HVAC interference. Passive infrared detectors lose reliability within 1.50 m of an air supply vent, generating blind spots.
- Ignoring natural light. Detectors activating artificial lighting in broad daylight near glazed bays can cancel out a significant share of the theoretical energy gain.
- Underestimating the impact of furniture. Movable partitions, acoustic screens and plants alter coverage zones after delivery.
Best practice is to carry out a behavioural audit before sizing, then to plan for a post-move adjustment budget priced from the tender stage onward.
For the architect and lighting designer: bringing commissioning into the tender documents
Presence detection is too often treated in tender documents as a supply-and-install service, with no budgeted post-delivery calibration phase. This omission shifts responsibility to the operating client, who notices the drifts several months later with no contractual leverage.
Architectural integration requires three decisions to be locked in at the APD/PRO stage, before the lighting grid is fixed:
- Consistency between the lighting grid and the detection grid. A 1.35 x 1.35 m lighting grid aligned with the suspended ceiling module does not coincide with an optimal detection grid (3 to 6 m range depending on ceiling height). The trade-off must be settled at APD stage, not at EXE.
- Provisioning commissioning in the CCTP. Include in the lighting-lot CCTP a dedicated budget for post-delivery adjustment over 3 to 4 weeks, with a measured deliverable (before/after consumption readings). Without this line, fine calibration has no contractual basis.
- Articulation between illuminance levels and detection strategy. The standards set target illuminance levels (500 lux at the workstation, 300 lux in circulation areas), not detection thresholds or time delays. Consistency between target level and detection strategy falls to the lighting designer’s specifications, and must appear in the lighting calculation note.
The Kytom integration process then follows four sequenced phases, validated on design and build projects.
Phase 1: flow audit. On-site counts or use of badge data to map occupancy densities by zone and identify peak hours. This analysis frequently reveals significant gaps between the programme’s initial assumptions and the flows actually measured on site.
Phase 2: zoning definition. Correlation of actual flows, architectural constraints and technical interfaces (HVAC, solar gain, task lighting).
Phase 3: differentiated settings. The table below summarises the recommended time delays by space typology.
| Space typology | Time delay | Target level |
|---|---|---|
| Circulation areas, restrooms | 90 to 120 s | 100 to 200 lux |
| Workstations | 5 to 8 min | 500 lux |
| Meeting rooms | 12 to 15 min | 500 lux |
| Technical rooms | 3 to 5 min | 200 lux |
Phase 4: behavioural commissioning. Adjustments over 3 to 4 weeks post-delivery, based on consumption readings and user feedback.
Frequently asked questions
Which detector technology to choose between infrared, ultrasonic and dual technology?
On lighting lots instrumented by Kytom, simple passive infrared covers the majority of common commercial configurations. Dual technology only justifies its additional cost on the detection item in a few specific cases: meeting rooms with static occupants, restrooms with closed cubicles, spaces with furniture obstructing lines of sight, and rooms subject to significant thermal variations.


