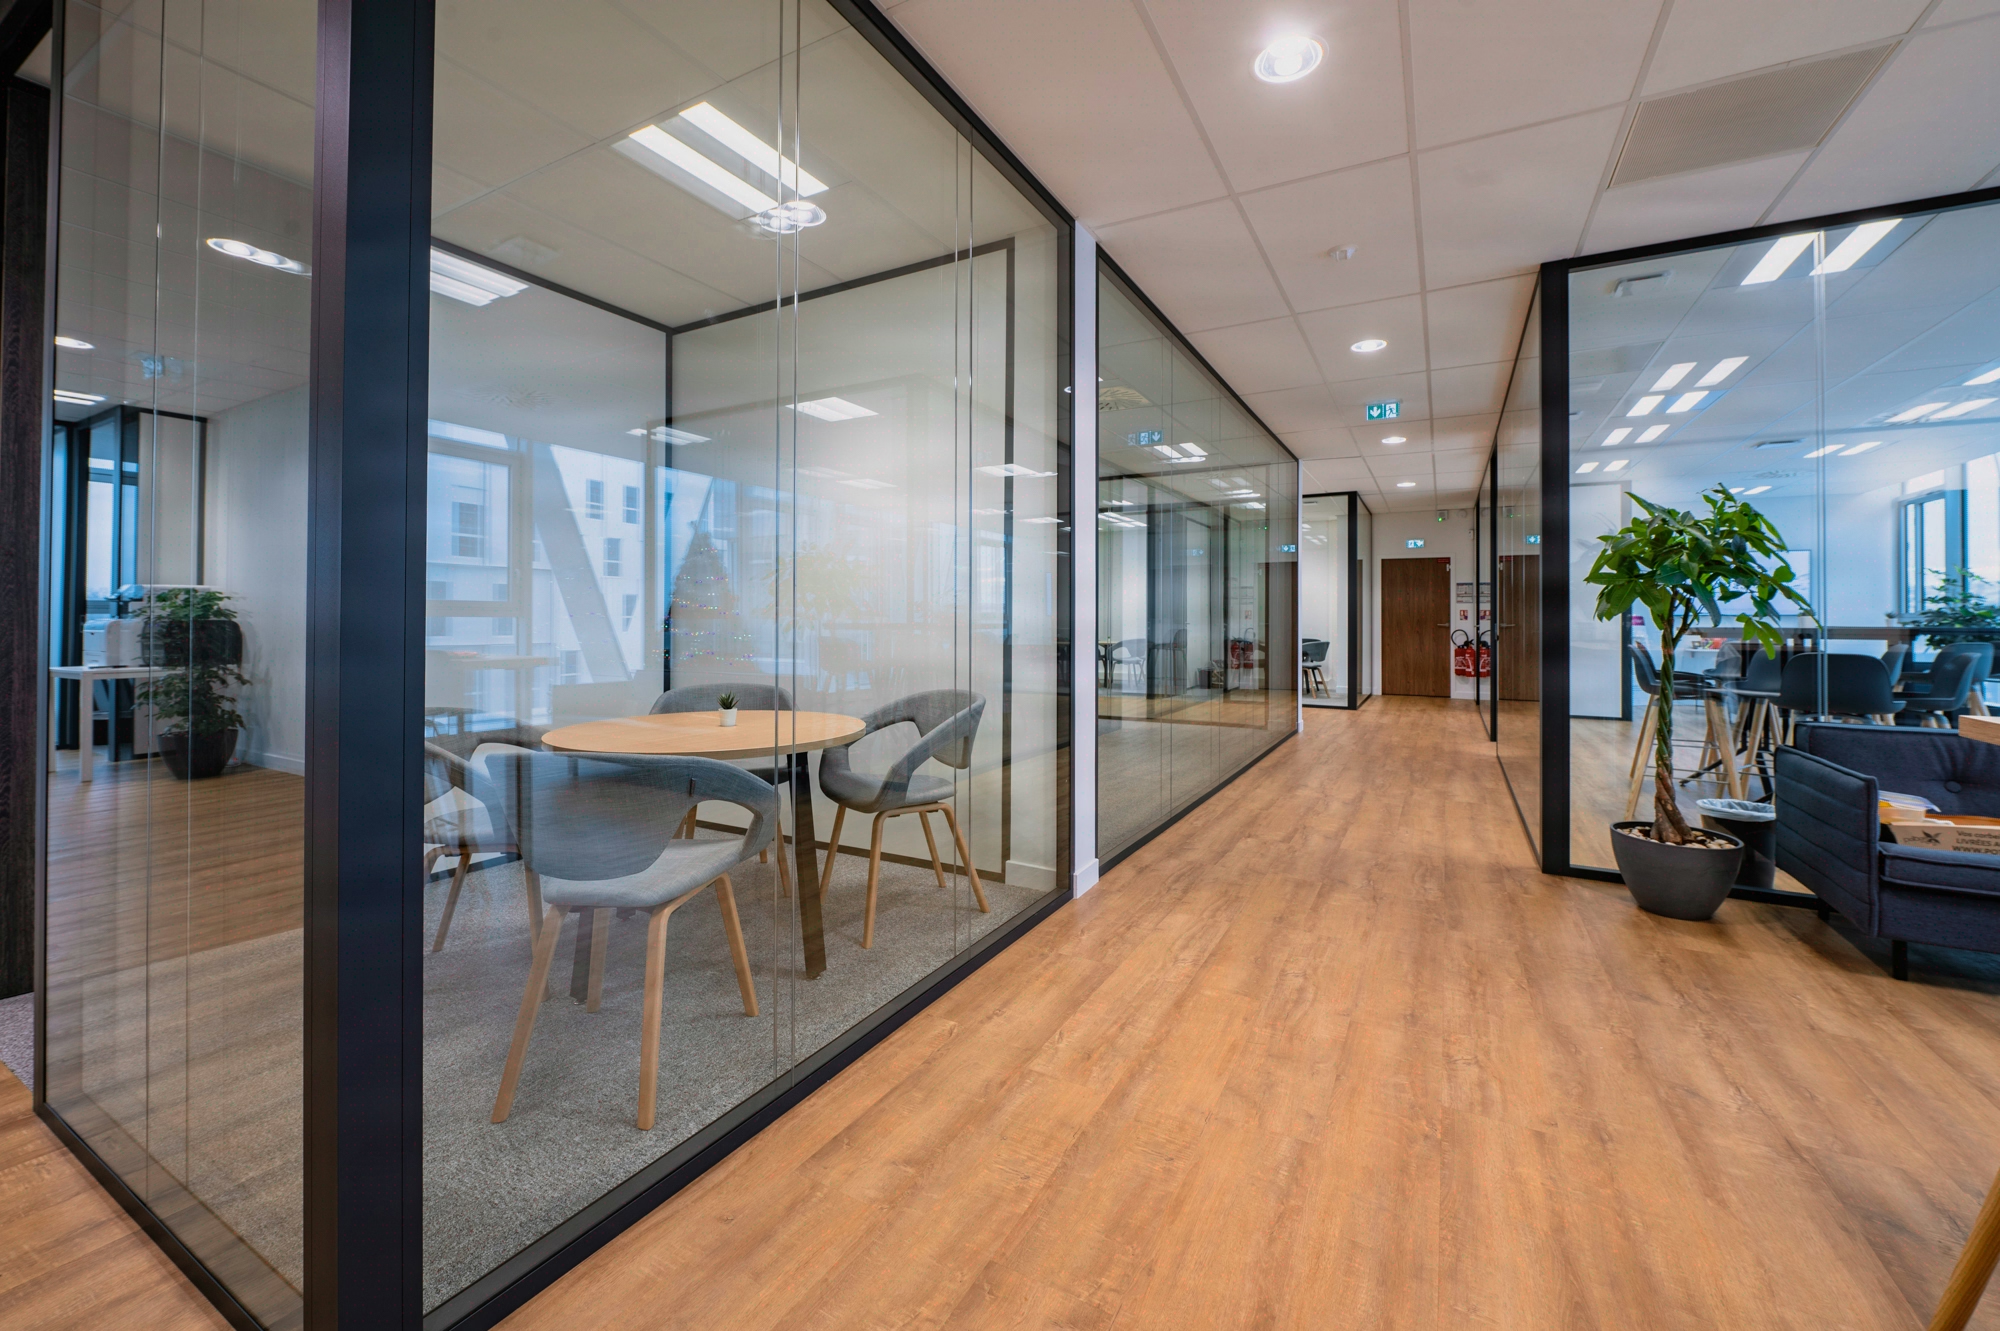
Lighting Simulation: Anticipating Ambiance and Energy Performance
Four normative parameters: 300-500 lux, UGR<19, 2700-4000 K, 8-12 W/m2
Lighting simulation is not a detailed design phase deliverable: it is an economic trade-off made at the sketch design phase. Choosing between 10 and 14 W/m2 of installed power amounts to several thousand kWh per year on a floor plate of typical size. Numerical modelling cross-references illuminance (300-500 lux), UGR

Tertiary simulation draws on the lighting standards for indoor workplaces (2021 edition) and on the tertiary decree trajectory managed via the OPERAT platform (ADEME). Four parameters calibrate the trade-off between visual comfort and performance.
- Maintained illuminance: 300 lux in circulation areas, 500 lux at office workstations, 750 lux in technical drawing zones.
- UGR (Unified Glare Rating): maximum threshold of 19 for any screen-equipped workstation.
- Colour temperature: 2,700-3,000 K for convivial spaces (client lounges, cafeteria), 3,500-4,000 K for dense tertiary floor plates.
- Installed power: target of 8-12 W/m2 with recent LED, versus 15-20 W/m2 on older fluorescent installations.
Kytom’s position, divergence from common practice. Contrary to the practice of treating colour temperature as a secondary comfort variable, our field experience indicates that a dense tertiary floor plate configured at 4,000 K generates more perceived discomfort than at 3,500 K for the same illuminance. Over 8-hour screen days, 3,500 K remains preferable outside visual precision zones.
Early coordination between the architect, building services engineering office and partition integrator sets these thresholds before the tender documents. On a typical 850 m2 floor plate, the gap between 10 and 14 W/m2 represents several thousand kWh per year depending on usage intensity.
When this normative approach is not enough. Below 200 m2 or for a single-use project (server room, cold archiving, technical room), full parametric simulation is not cost-effective: a standard DIALux calculation with default values covers the essentials at a much lower cost. The 5-step Kytom method is justified on floor plates > 400 m2 with mixed uses.

Four modelling errors that distort the forecast
The gaps between simulation and post-delivery measurement stem from poorly calibrated calculation assumptions. Four recurring errors emerge from our comparative post-delivery audits.
- Underestimation of movable partitions: on a frequently reconfigured flex office floor plate, illuminance uniformity degrades appreciably if glazed partitions are not modelled with their actual transmission coefficients.
- Overestimated maintenance factor: the default value of 0.8 overestimates performance at 4 years. A factor of 0.7, incorporating dust accumulation and LED drift, more faithfully reflects the reality of a French tertiary installation 3-4 years after commissioning. Our reading here differs from the common practice of engineering offices that keep 0.8 out of routine.
- Average weather scenarios only: testing without an overcast winter sky masks the morning supplementary lighting needs in deep zones.
- No BMS coupling: simulation often ignores presence detection and zone-based dimming, which can significantly modulate actual consumption depending on the floor plate configuration.
Integrating the final furniture (desks, acoustic screens, high storage units) into the 3D model reveals unpredictable shadow zones and makes it possible to reposition luminaires before the suspended ceilings are manufactured.
For the architect: 5 steps to turn a technical task into a design trade-off
For the architect or lighting designer, simulation ceases to be an imposed engineering office deliverable and becomes a tool for sketch design trade-offs: finishing materials, floor and wall reflection coefficients, usable ceiling height and luminaire layout become variables negotiated with the client before the tender documents, not after. The design and build method runs over 5 to 7 weeks, in parallel with the detailed design phase.
| Step | Deliverable | Duration |
|---|---|---|
| 1. Usage audit | Occupancy count, mapping of visual tasks by zone | 2-3 wks |
| 2. 3D modelling | Model integrating materials, reflection coefficients, solar masks | 1 wk |
| 3. Climate scenarios | Calculations at solstices, equinoxes, overcast winter sky | 1 wk |
| 4. Energy optimisation | LED technology comparison, ROI at 5 and 10 years | 1 wk |
| 5. Immersive validation | Digital model presented to end users | 0.5 wk |
Step 1 distinguishes the 300 lux zones (circulation areas, archiving), 500 lux (open-plan offices) and 750 lux (technical workstations), according to the normative thresholds applicable to tertiary spaces. Step 2 measures actual reflection coefficients (floors 0.2-0.3; walls 0.5-0.7; ceilings 0.7-0.8) on material samples, rather than the default values of simulation software. Step 5 significantly reduces modification requests during the pre-acceptance phase, by enabling teams to validate lighting ambiances before execution.
Limitations of the method. This sequence ceases to be relevant in three cases: a project on an occupied site with a tight schedule (the usage audit requires 2 to 3 weeks minimum), a very constrained lighting budget envelope (simulation would then represent a disproportionate share of the package), or a partial renovation retaining most of the existing equipment. In these cases, Kytom switches to a targeted zone-by-zone calculation without full 3D modelling.

Measured results: a controlled forecast/actual gap
On tertiary projects delivered since 2021 and instrumented post-delivery (dedicated lighting sub-panel meters, lux measurements at workstations at 6 and 12 months), Kytom observes two consolidated results.
- Energy gap: a controlled gap between forecast and actual measurement at 12 months, appreciably smaller than on equivalent projects carried out without prior simulation.
- Reduction in rework: 2 to 3 weeks of fine-tuning avoided during the pre-acceptance phase.
On floor plates > 400 m2 with mixed uses, the 5-step Kytom method over 5 to 7 weeks delivers its ROI. Below 200 m2 or for single-use, a standard DIALux calculation covers the essentials at a lower cost.
Frequently asked questions
When does lighting simulation become cost-effective on a tertiary project?
On floor plates > 400 m2 with mixed uses, the 5-step Kytom method over 5 to 7 weeks delivers its ROI, by securing the gap between energy forecast and actual measurement at 12 months. Below 200 m2 or for single-use (server room, archiving), a standard DIALux calculation covers the essentials at a lower cost.
Why a maintenance factor of 0.7 rather than 0.8?
The default value of 0.8 overestimates performance at 4 years, by underestimating dust accumulation and LED drift. Our post-delivery lux measurements on French tertiary installations show that a factor of 0.7 more faithfully reflects the maintained performance at 3-4 years, and therefore secures the energy trade-off during the design phase.


